
Henrike Schulte to Bühne
Institute of Zoology, Zoological Society of London, London, UK
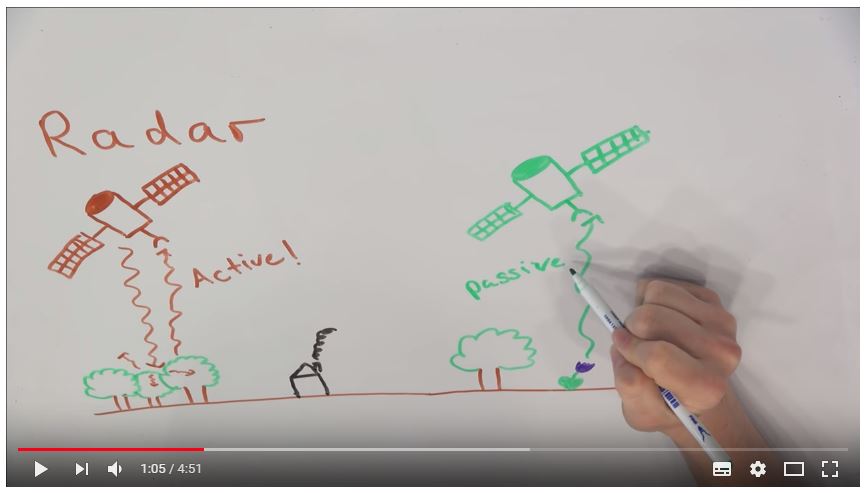
In the 21st century, ecologists and conservation scientists have embraced satellite imagery as a valuable tool for mapping and monitoring ecosystems, species and threats to biodiversity. Multispectral and radar satellite data in particular have become mainstream sources of ecological data. These two types of satellite data are acquired in very different ways – one is passive, one is active; one focuses on the visible and near-infrared part of the electromagnetic spectrum, and one on the longer microwaves. In a nutshell, they provide very different, and potentially complementary, information about the Earth’s surface. This got Nathalie Pettorelli and me wondering: would systematically combining multispectral and radar data benefit biodiversity monitoring from space? After all, if they provide complementary information, combining them might give a richer view of the Earth’s surface, including patterns and processes of biodiversity.
We searched for case studies across the ecology and conservation science literature in which multispectral and radar satellite data had been used to map ecosystems, species, or threats to biodiversity. And it turned out that, yes, in many cases, combining these two data types results in more accurate biodiversity observations than using either data type alone! For instance, joint use of multispectral and radar imagery can increase the accuracy with which different successional stages of forests can be distinguished (Lu et al. 2011, 2014), or wetlands can be mapped (Fu et al. 2017). Species distribution models – whether of animals (Bergen et al. 2007) or plants (Wolter & Townsend 2011) – are often better at predicting species presence when multispectral and radar data are combined. Threat monitoring can also benefit from using both types of data, e.g. for detecting deforestation (Reiche et al. 2015). (A longer version of this answer is available as a review we recently published here http://onlinelibrary.wiley.com/doi/10.1111/2041-210X.12942/abstract).
So how can you go about systematically combining different types of satellite data? There are quite a few different techniques, all falling under the umbrella term satellite data fusion. At the moment, the most commonly used method (at least for monitoring biodiversity) is so-called decision level fusion – e.g. simultaneously using multispectral and radar imagery in a land cover classification algorithm such as Random Forest. Satellite data fusion can also mean that completely new imagery is created, during so-called image fusion: This can be achieved via object-based segmentation (in which similar pixels are clustered together), or pixel-level fusion. Pixel-level fusion combines data values for the same pixel from different satellite images to derive a completely new value, as is the case e.g. in pansharpening. Many satellite data fusion techniques have already been implemented in open source software. For instance, the R Package “RStoolbox” (https://cran.r-project.org/web/packages/RStoolbox/index.html) has functions for fusing satellite imagery via principal component analysis or intensity-hue transformation, whilst SAGA (http://www.saga-gis.org) allows object-based image segmentation (there is a handy figure in the review in which we list these resources in more detail).

In the past, fusing multispectral and radar satellite data could quickly exhaust limited computational resources, and was technically challenging. For instance, it used to be difficult getting imagery from different satellites precisely aligned, but this is absolutely necessary to be able to detect land cover and changes therein. However, computing power continues to grow, and many of the technical issues surrounding fusion of multispectral and radar data have been alleviated with the advent of ESA’s Sentinel 1 and 2 missions (https://sentinel.esa.int), which provide open access to multispectral and radar imagery, already co-registered, for the entire globe.
Satellite data are abundant and accessible as never before, and existing fusion tools are a great opportunity to make the most of synergies between them. Deriving richer and more accurate observations of biodiversity from space might even contribute to operational large-scale biodiversity monitoring. In this way, satellite data fusion could be one piece of the puzzle helping us understand living Earth, and the challenges it faces, better than before.
See below for a video abstract of the review:

See below for another paper from Henrike Schulte to Bühne and Nathalie Pettorelli, published in 2017 in Remote Sensing in Ecology and Conservation:
References
Bergen, K. M., Gilboy, A. M., & Brown, D. G. (2007). Multi-dimensional vegetation structure in modeling avian habitat. Ecological Informatics, 2, 9–22. https://doi.org/10.1016/j.ecoinf.2007.01.001
Fu, B., Wang, Y., Campbell, A., Li, Y., Zhang, B., Yin, S., … Jin, X. (2017). Comparison of object-based and pixel-based Random Forest algorithm for wetland vegetation mapping using high spatial resolution GF-1 and SAR data. Ecological Indicators, 73, 105–117. https://doi.org/10.1016/j.ecolind.2016.09.029
Lu, D., Li, G., Moran, E., Dutra, L., & Batistella, M. (2011). A comparison of multisensor integration methods for land cover classification in the Brazilian Amazon. GIScience & Remote Sensing, 48, 345–370. https://doi.org/10.2747/1548-1603.48.3.345
Lu, D., Li, G., Moran, E., & Kuang, W. (2014). A comparative analysis of approaches for successional vegetation classification in the Brazilian Amazon. GIScience & Remote Sensing, 51, 695–709. https://doi.org/10.1080/15481603.2014.983338
Reiche, J., Verbesselt, J., Hoekman, D., & Herold, M. (2015). Fusing Landsat and SAR time series to detect deforestation in the tropics. Remote Sensing of Environment, 156, 276–293. https://doi-org.iclibezp1.cc.ic.ac.uk/10.1016/j.rse.2014.10.001
Wolter, P. T., & Townsend, P. A. (2011). Multi-sensor data fusion for estimating forest species composition and abundance in northern Minnesota. Remote Sensing of Environment, 115, 671–691. https://doi.org/10.1016/j.rse.2010.10.010
