
Merry Crowson
Institute of Zoology, Zoological Society of London, London, UK
“The world is one big data problem.” (Andrew McAfee)
There is a lot of excitement in the scientific community surrounding the potential of big data – that is, the recent exponential increase in the amount and variety of data, as well as the speed at which we can process it. The Landsat and Sentinel satellite missions alone beam a vast amount of data down to us every day, inviting us to transform this information into knowledge about the changes occurring on the surface of our planet. This is no small task, and those of us working on mapping land cover are continually striving to improve the accuracy of our maps and pushing at the frontier of what is “mappable” from space – that is to say, squeezing out every last drop of insight from the information available to us.
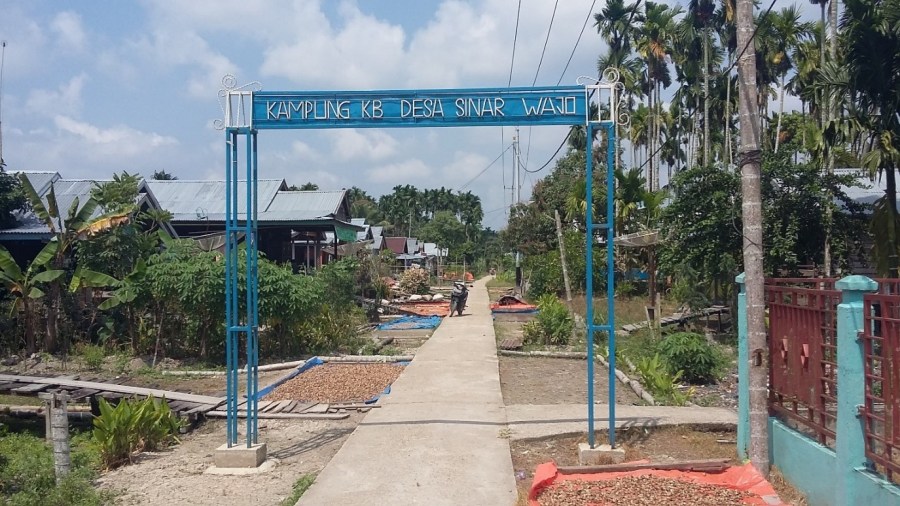
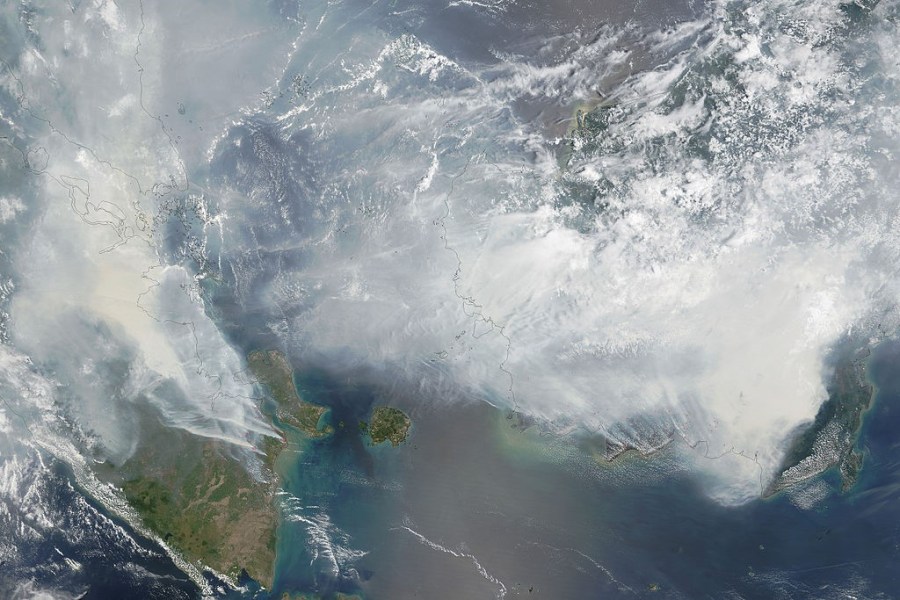
The real world problems we are trying to solve with our data are often pressing. In Sumatra, Indonesia, tropical peat swamp forest is being lost at an alarming rate, due to conversion to plantations and fire. During a recent workshop in Sumatra, Indonesia, we walked under a baking sun through an area of tropical peatland that had burnt a few years earlier. In its natural state, tropical peatland does not usually burn because of the high water table in the peat. However, when tropical peatland forest is cleared and replaced with palm oil or acacia plantations, it is common to dig canals to drain the peat in order to increase productivity. Unfortunately, this also makes the peat more prone to fires, destroying peat swamp forest and plantations, and releasing a huge amount of CO2 into the atmosphere. Burning tropical peatland in Indonesia made international headlines in 2015, because the fires where so severe the haze reached as far as Singapore and Malaysia, creating concern about the effects on people’s health.

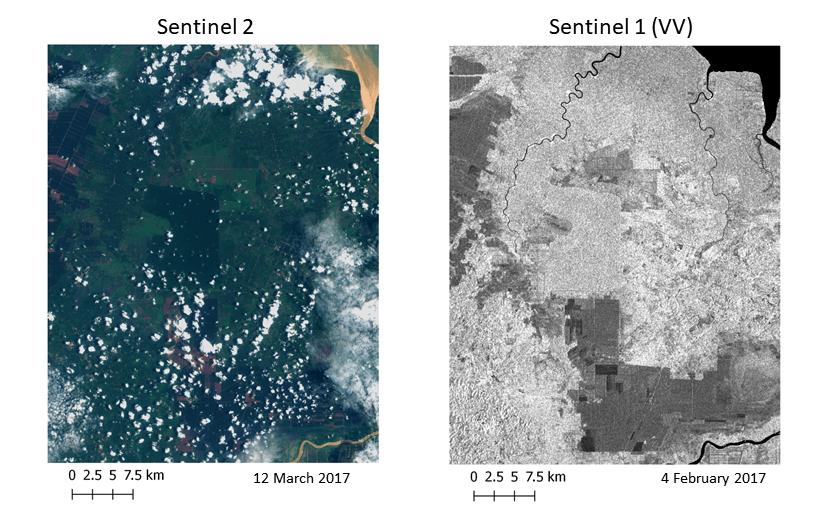
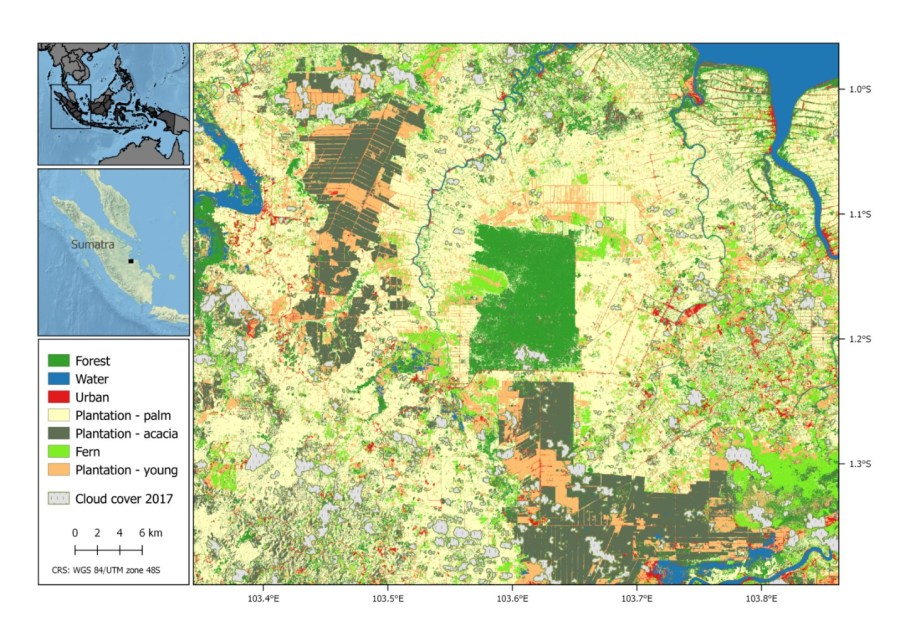
Up-to-date land cover maps underpin efforts by scientists and policy makers to preserve areas of tropical peat swamp forest, restore a high water table within peatland areas and ensure economic development. However, mapping land cover in Sumatra is particularly challenging because this tropical region has high cloud cover year-round. Optical sensors, such as Sentinel-2, passively measure electromagnetic radiation reflected from the Earth’s surface. This means that cloud cover “blocks the view” of the Earth’s surface. Radar sensors, on the other hand, actively emit electromagnetic radiation in wavelengths that penetrate cloud and measure the returning signal, which means that they can “see through” cloud. Although there are difficulties with mapping land cover with radar alone, combining these two data types using data fusion is an ongoing research area.
In our paper we take three different approaches to data fusion and compared the results against the use of a single data type. Our results clearly show that optical data remains the main data source for mapping land cover, even in areas with lots of cloud. The results using data fusion did show some improvement compared to the use of optical data only, but this improvement was small, and only statistically significant in one of the methods we applied. This suggests that those considering using data fusion within a project need to weigh up the benefits of a small increase in accuracy, against the extra processing time and expertise required.
The availability of services such as the cloud-based platform Google Earth Engine and the free virtual machines provided by the European Space Agency, mean that we have an increased capacity to answer important questions using large and varied datasets. This potential is also likely to make workflow more complex, however. Particularly In the context of conservation, where budgets are often tight and the questions being asked are of immediate practical importance, it is particularly important to weigh up the potential benefits and costs of data fusion on a case by case basis.
See below for the paper from Merry Crowson, published in 2018 in Remote Sensing in Ecology and Conservation:
