
By Tim O’Brien
This blog is an accompaniment to the paper: Camera trapping reveals trends in forest duiker populations in African National Parks. Read the full paper here
Presence-absence surveys (more properly detection-nondetection surveys) and occupancy surveys, are often used as indicators of the health of wildlife population. Occupancy surveys use a replicated sampling design where sampling units are surveyed > 2 times, allowing estimation of the probability that a sampling unit is occupied, and provides unbiased estimated of occupancy and use. If we include features of the sampling unit relevant to species occurrence (i.e. proximity to roads) and detectability (i.e. vegetation density), then we can tailor detection probability and occupancy estimates to those features. Heterogeneity in detection probability is an important consideration in estimating abundance and distribution. As Andy Royle and Jim Nichols (Royle and Nicholls 2003) note, one of the most important sources of heterogeneity in detection is the variation in animal abundance among sites. Simply put, the more individuals in a sample unit, the more likely you are to detect at least one individual during surveys. They developed models to determine information about abundance from occupancy surveys.
Although Royle and Nichols published their insights in 2003, the models have not been widely tested or used. O’Brien and Kinnaird (2008) illustrated the use of Royle-Nichols models to estimate changes in abundance of Argus pheasant populations in a Sumatran national park, comparing the results to density estimates from line transect surveys. Gopalaswamy et al. (2012) used Royle-Nichols models to estimate abundance of tiger prey India and also compared them to line transect surveys. Linden et al. (2017) compared Royle-Nichols abundance estimates of fishers in New York to spatially explicit capture recapture estimates. These latter two studies conclude that, although abundance estimates were a bit lower for Royle-Nichols models compared to other sampling methods, the correlation between estimates was high (r = 0.975) indicating that Royle-Nichols estimates accurately track changes in density and abundance of other accepted, unbiased estimation procedures.
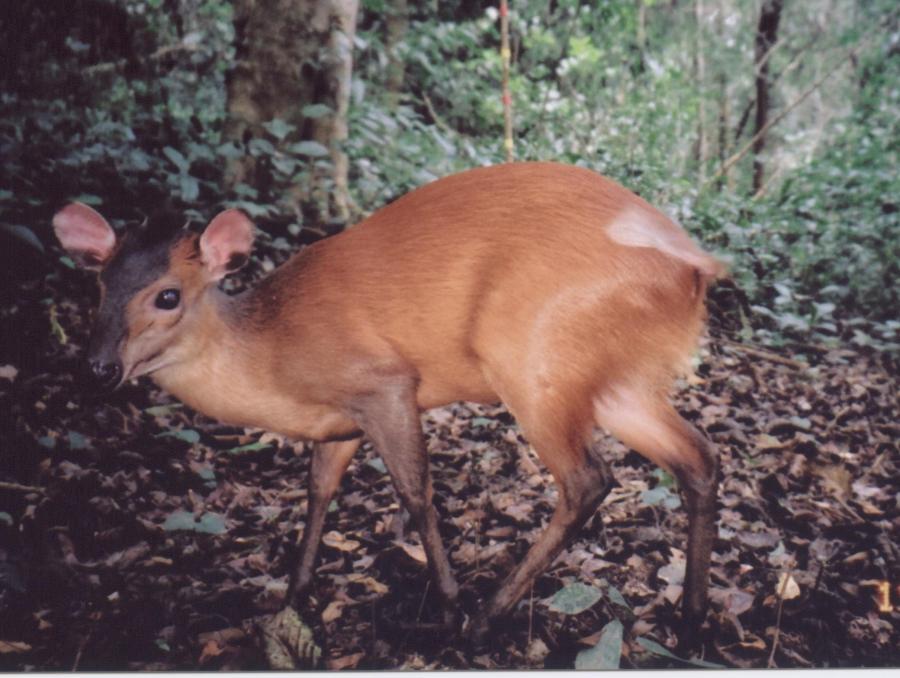
Royle-Nichols models have potential for tracking trends in abundance for species that are rare, nocturnal, cryptic, or react to human presence. They are also useful for monitoring species that do not have distinctive individual identification marks. One group of animals sharing these features are forest duikers of Africa. Forest duikers range in size from 3 to 70 kg, are monogamous and territorial, and feed on leaves, shoots, seeds, fruits, and buds. This group lacks individual markings and includes species that are rare, nocturnal, and shy. Duikers are also widely hunted for bushmeat, so management requires a good understanding of trends in exploited populations.
We reviewed the literature on forest duiker abundance/density from 1973 to 2013. We found duiker densities had declined across Africa during this time. Surprisingly, unhunted duiker populations showed a greater rate of decline than hunted populations. Unhunted populations, however, occurred at almost three times the density of hunted populations, indicating that hunted populations had perhaps stabilized at low densities a while ago.
We then applied Royle-Nichols models to multi-year camera trap datasets (4 – 9 years) of forest duikers in six African parks. Five of these parks were Tropical Ecology Assessment and Monitoring (TEAM network) sites using a standardized sampling protocol (TEAM Network 2011) and one site was monitored by WCS site using the TEAM protocol. Five parks had high human density on the boundaries and experienced hunting for bushmeat. The parks contained a total of 11 duiker species in combinations of 3 to 6 species per park. Our monitoring program reliably detected 9 species. Because duikers have small territories, we expected that, on average, a camera trap was in the territory of a single duiker pair, and that a healthy duiker population would have 2 – 4 individuals per camera point, representing a pair and offspring. Abundance in the range of 1 – 1.99 would indicate some empty territories or unmated duikers. Duiker populations with abundance < 1 were considered rare or overexploited.
Estimated mean point abundance over time was between 0 and 0.99 individuals/point for four populations, between 1.0 and 1.99 for six populations, and greater than 2.0 for five populations. Five populations of duikers had negative trends in point abundances (1 significant). Abundances for three of these populations were above 2.0 in the final survey year. Six populations showed positive trends in point abundance (3 significant), and remaining populations displayed no trends. Average occupancy was high (Ψ > 0.60) except for three populations. Of the three, one species is considered rare, one species was under-sampled in its preferred habitat, and one species was likely overexploited. Our results indicate that these parks are effective in protecting most duikers despite hunting pressure.

This study illustrates the usefulness of using camera traps to monitor exploited populations in forests. Another potential application is in large cat conservation, where prey recovery is a basic conservation strategy. Currently, line transect surveys are the preferred method to monitor prey populations, but because of cost, few organizations actually monitor prey in their cat conservation programs. In programs using camera traps to monitor cats, analysis of prey by-catch might yield valuable information on prey recovery efforts.
